
Monitor Stalwart HA clusters with Grafana Cloud
Introduction
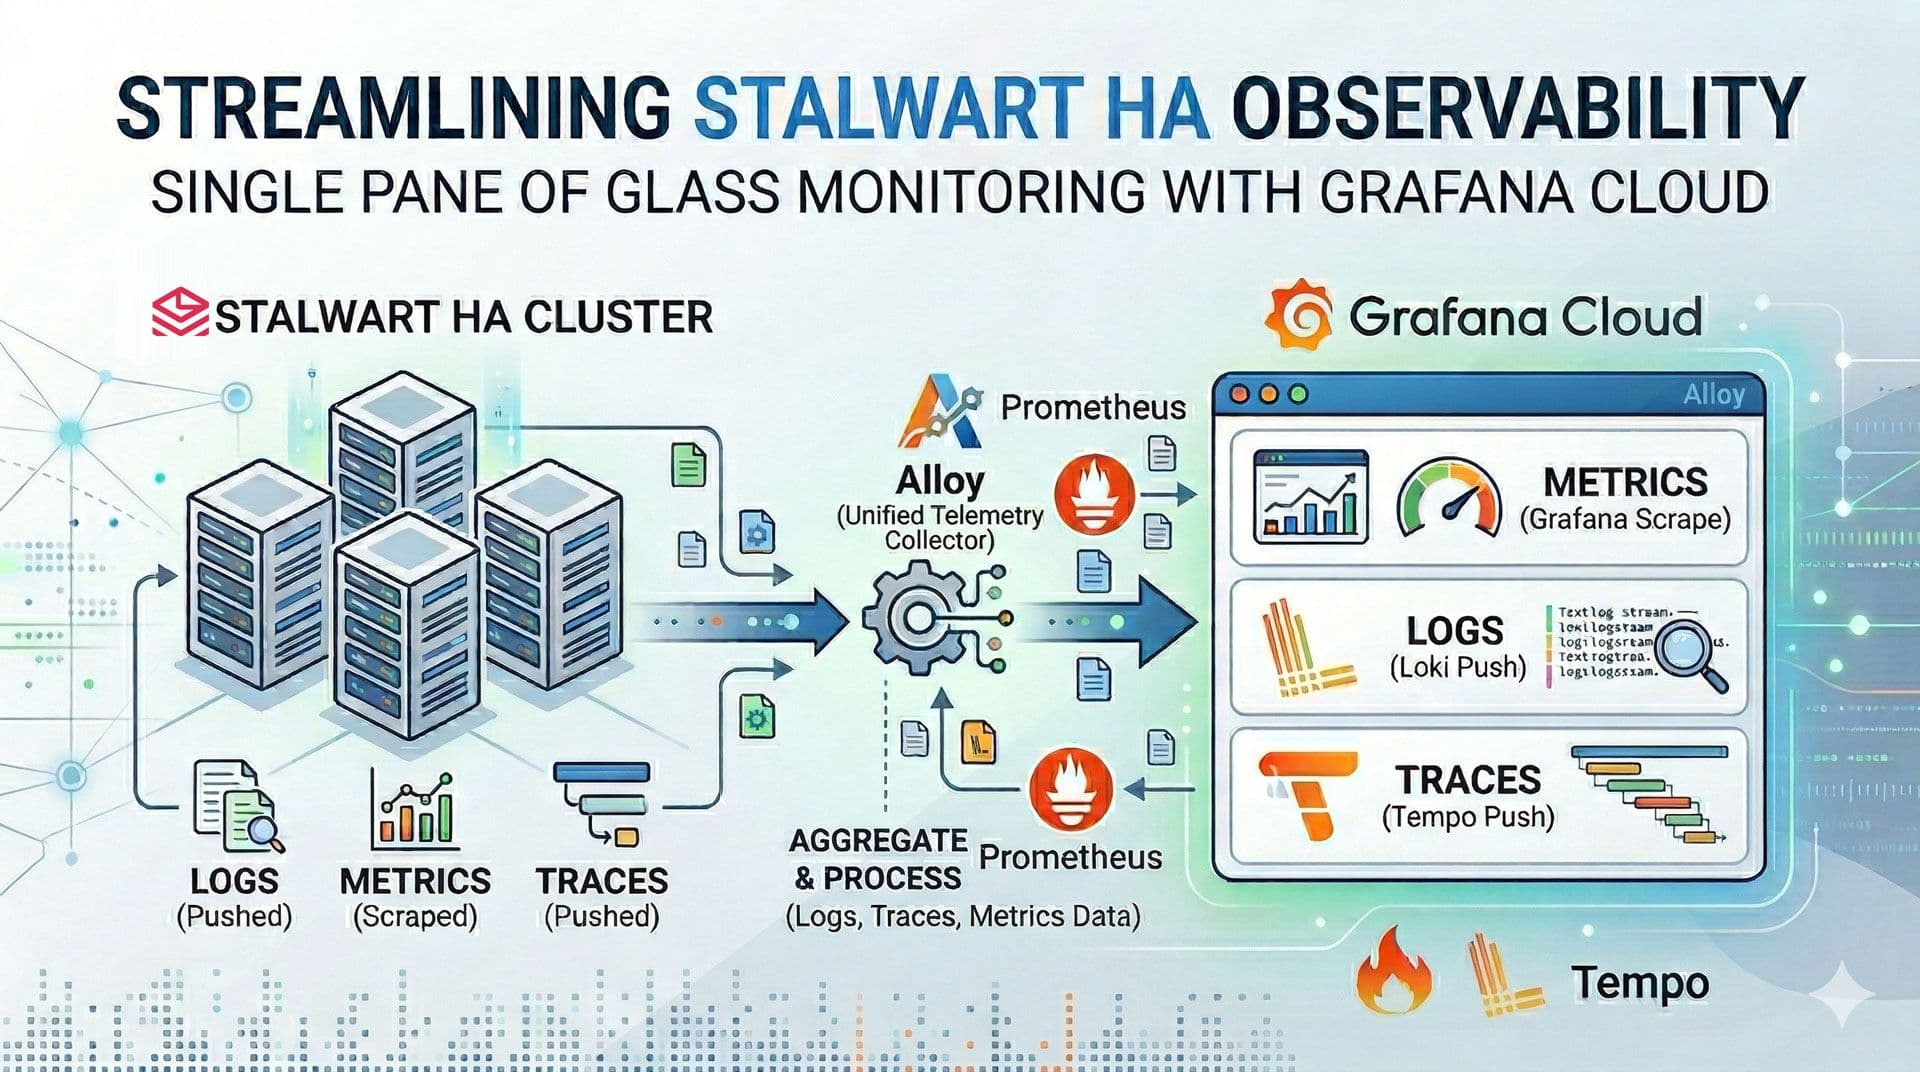
When running Stalwart in an HA configuration, keeping an eye on your cluster can be quite a challenge. Having separate log files for each instance makes it a struggle to monitor performance or troubleshoot issues effectively. Today, I'll show you how to streamline your workflow by sending your logs, metrics, and traces to Grafana Cloud. This setup gives you a single 'pane of glass' to observe, manage, and optimize your Stalwart cluster with ease.
Prerequisites
- A Stalwart HA cluster.
- A free Grafana Cloud account.
Step-by-step
We implement a pull-based model for metrics, where Prometheus scrapes data directly from Stalwart. For logs and traces, we utilize a push-based model, transmitting data to Grafana Cloud via Alloy, which serves as a proxy for forwarding telemetry.
-
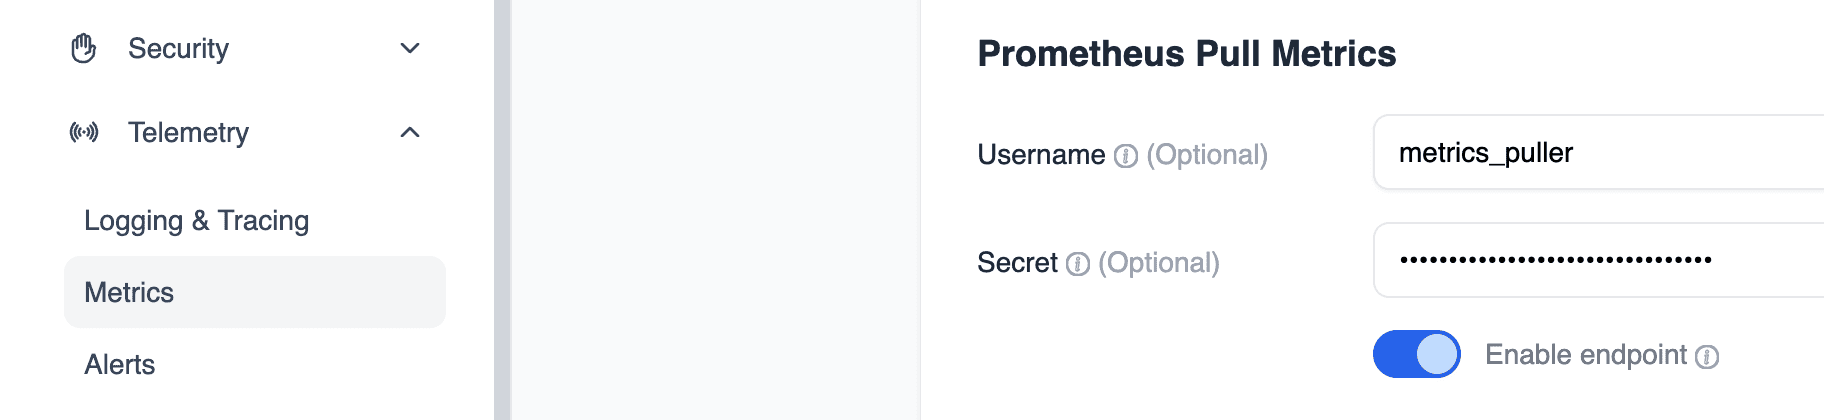
Configure Prometheus Authentication:
In Stalwart UI, set up the necessary credentials (Username and Secret) to allow Prometheus to securely scrape metrics from the Stalwart instance.
-
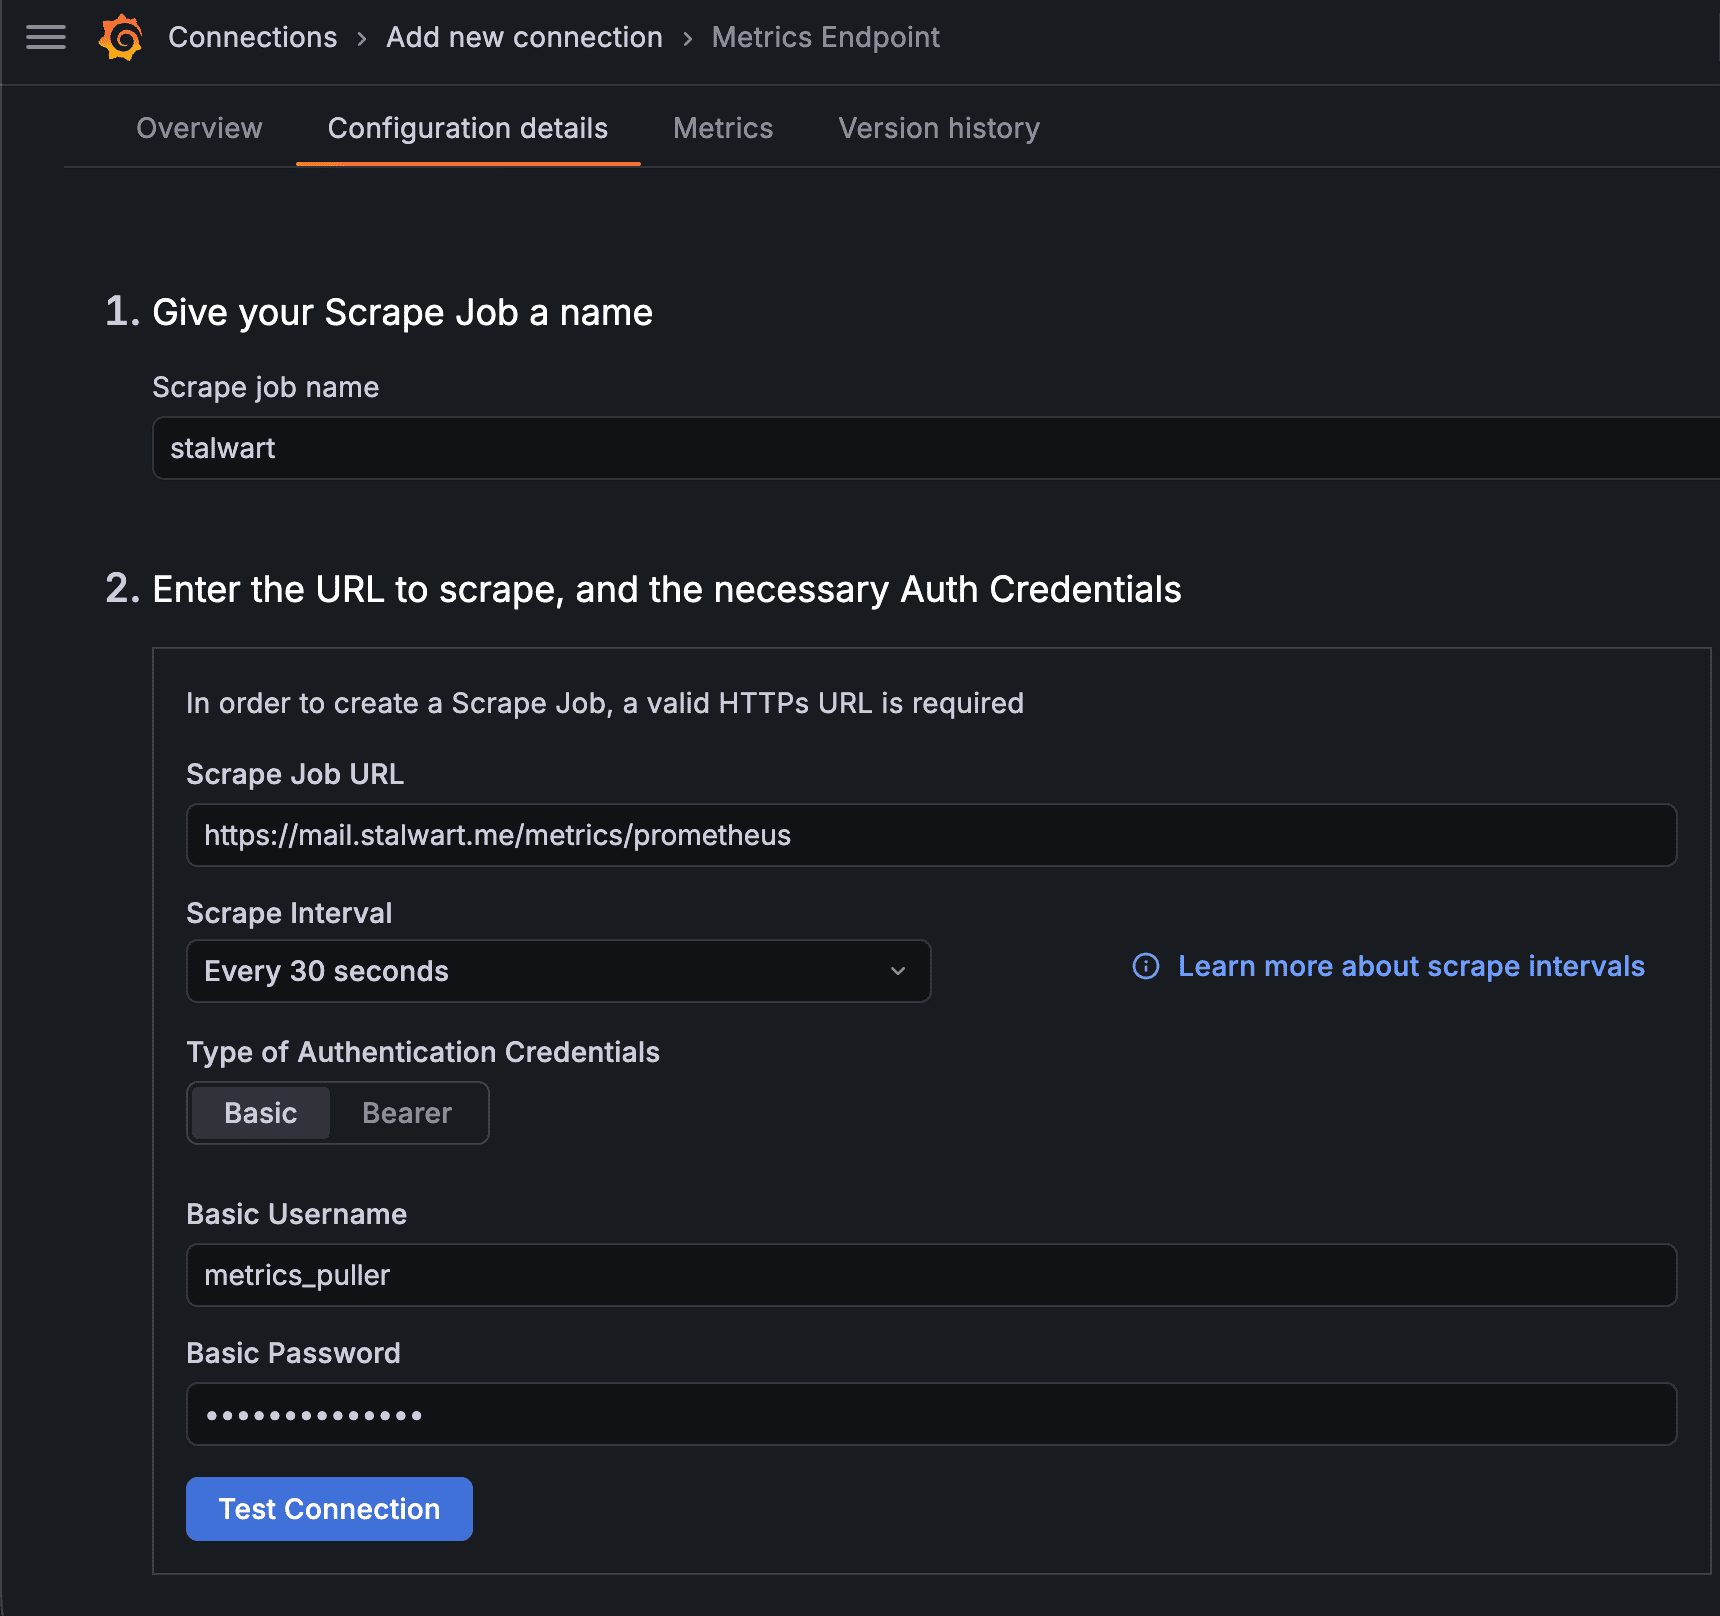
Establish the Scrape Job:
In the Grafana Cloud interface, navigate to Connections > Add new connection > Metrics Endpoint. Define a new scrape job by entering your Stalwart configuration details and credentials.
-
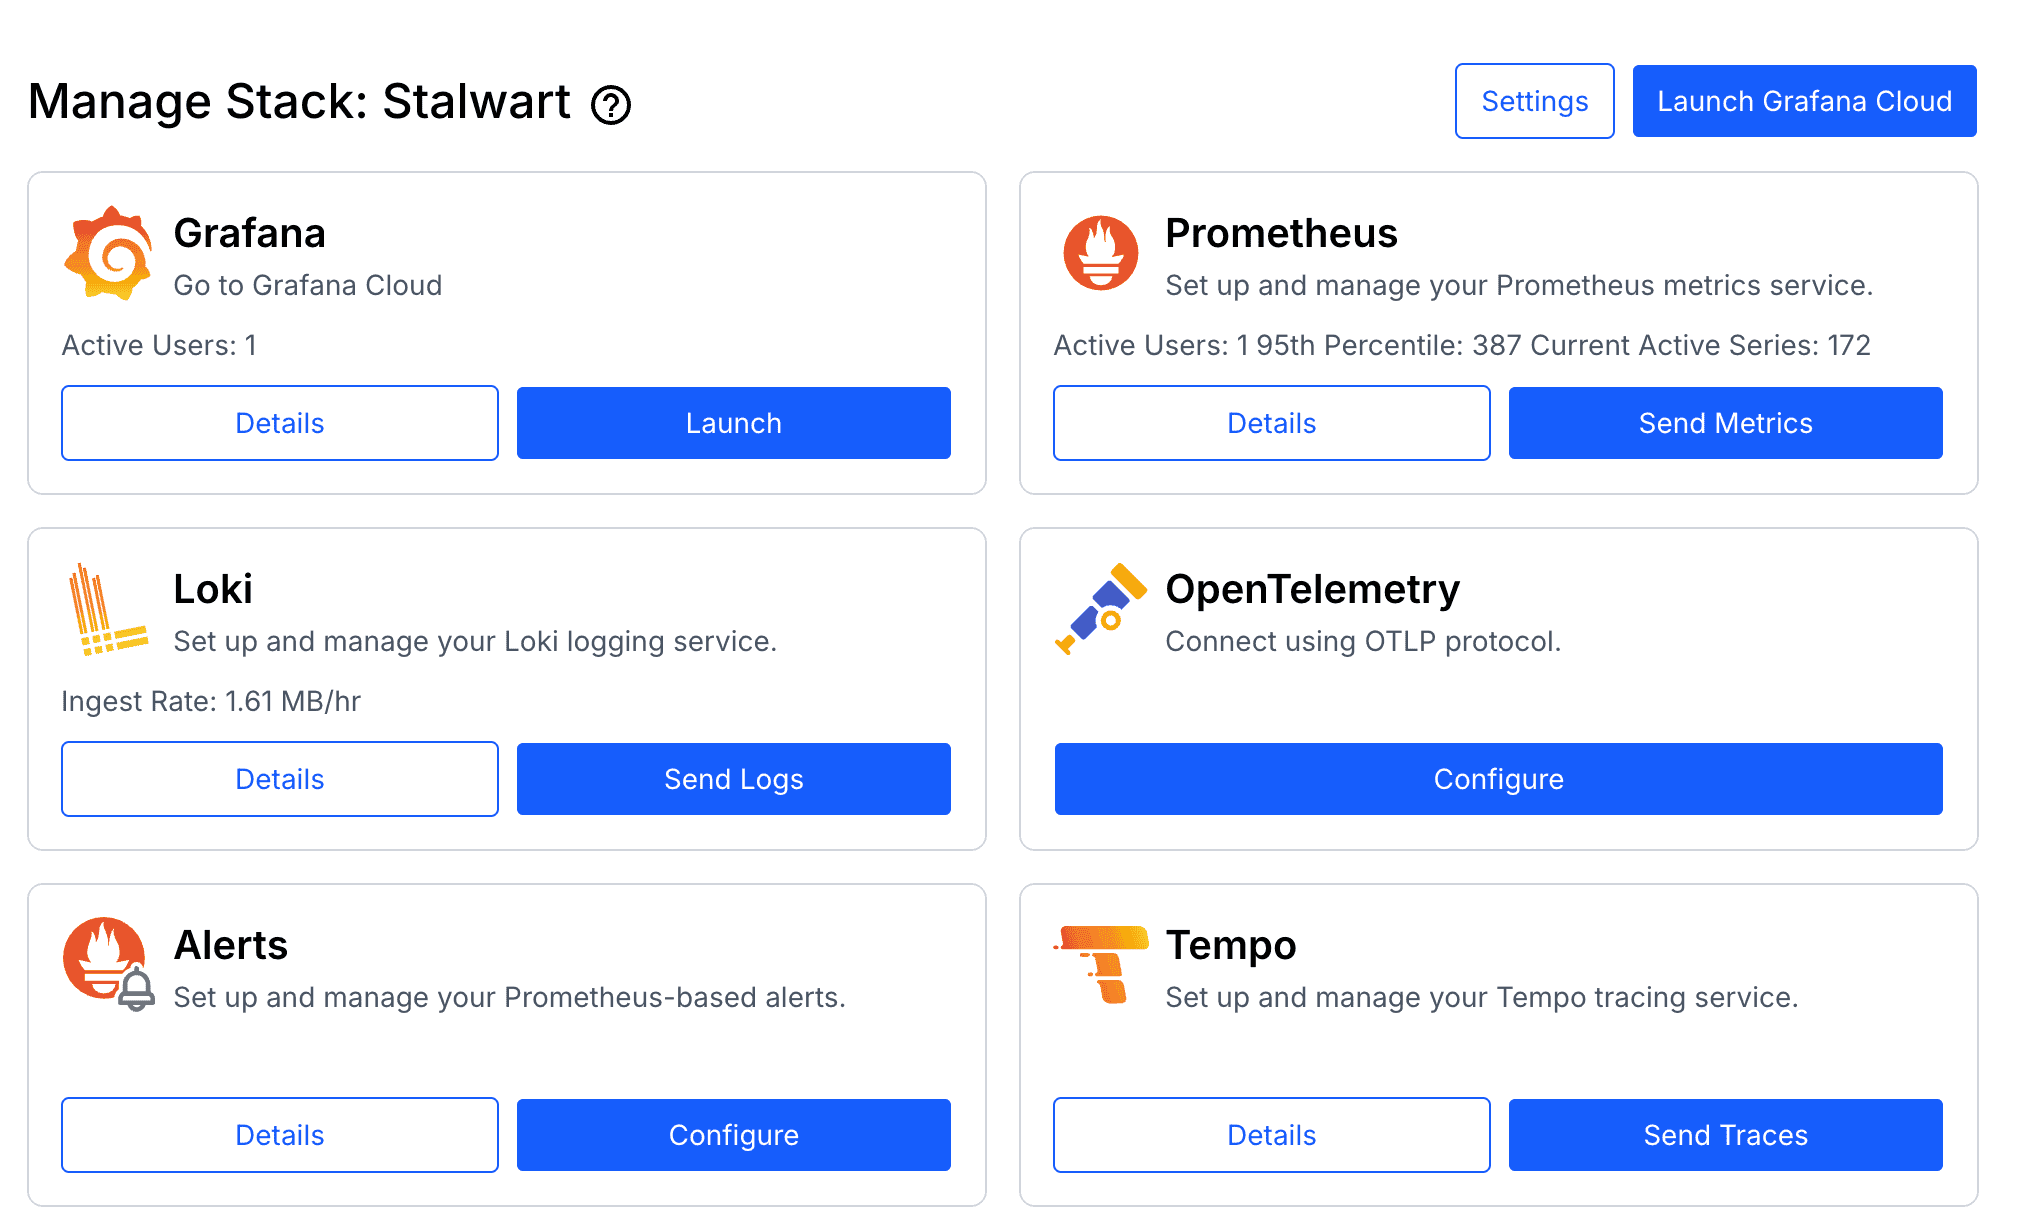
Generate Telemetry Tokens:
Access the Grafana Cloud Portal, select your stack, and navigate to Send Logs (Loki) and Send Traces (Tempo) to generate the authentication tokens required for Alloy.
-
Deploy Alloy Configuration:
Create the
config.alloyfile on every Stalwart instance to define the data routing logic.tomlotelcol.auth.basic "grafanacloud_traces" { username = "YOUR_TEMPO_USERNAME" password = "YOUR_TEMPO_API_KEY" } otelcol.receiver.otlp "default" { grpc { endpoint = "0.0.0.0:4317" } http { endpoint = "0.0.0.0:4318" } output { logs = [otelcol.exporter.loki.grafanacloud.input] traces = [otelcol.exporter.otlp.grafanacloud_tempo.input] } } otelcol.exporter.loki "grafanacloud" { forward_to = [loki.write.grafanacloud.receiver] } loki.write "grafanacloud" { endpoint { url = "https://logs-prod-035.grafana.net/loki/api/v1/push" basic_auth { username = "YOUR_LOKI_USERNAME" password = "YOUR_LOKI_API_KEY" } } } otelcol.exporter.otlp "grafanacloud_tempo" { client { endpoint = "tempo-prod-25-prod-gb-south-1.grafana.net:443" auth = otelcol.auth.basic.grafanacloud_traces.handler } } -
Launch via Docker Compose:
Start the Alloy service using Docker Compose to begin processing and forwarding telemetry.
yamlstalwart: image: stalwartlabs/stalwart:v0.15.5 container_name: stalwart restart: unless-stopped networks: - ip6net ports: - "443:443" - "8080:8080" - "25:25" - "587:587" - "465:465" - "143:143" - "993:993" - "4190:4190" - "110:110" - "995:995" volumes: - ./data:/opt/stalwart alloy: image: grafana/alloy:v1.14.2 container_name: alloy networks: - ip6net command: - run - /etc/alloy/config.alloy ports: - "4317:4317" - "4318:4318" volumes: - ./config.alloy:/etc/alloy/config.alloy:ro restart: unless-stopped -
Configure Stalwart Export:
Update the Stalwart configuration to point logs and traces toward Alloy, which then acts as a proxy to forward the data to Loki and Tempo in Grafana Cloud.
tomltracer.alloy.enable = true tracer.alloy.enable.log-exporter = true tracer.alloy.enable.span-exporter = true tracer.alloy.endpoint = "http://alloy:4317" tracer.alloy.level = "debug" tracer.alloy.lossy = false tracer.alloy.throttle = "1s" tracer.alloy.timeout = "10s" tracer.alloy.transport = "grpc" tracer.alloy.type = "open-telemetry"
Conclusion
Congratulations! You have successfully centralized your Stalwart logs, traces, and metrics within Grafana Cloud. This unified, high-visibility interface simplifies the monitoring and maintenance of your Stalwart High Availability (HA) cluster, providing the insights needed to manage your infrastructure with ease.


References
If you found this useful, you can buy me a coffee! Thanks for the support!